Monitoring Connect Box cable modems with Prometheus and Grafana
To be able to monitor the internet connection status of my Connect Box cable modem, I built a Prometheus exporter and a Grafana dashboard. It’s all on Github (links on the bottom) so you can monitor your own Connect Box as well.
Why all of this? A motivational story
Back when we moved in to our current place, we brought our Unitymedia cable internet contract along with us. Unfortunately, the internet connection at our (then) new place was worse than before: speeds were okay, but the connection would drop randomly or the modem would restart on its own.
To summarize a long story, we went through three frustrating months of countless support hotline calls and six or seven visits by cable technicians. It took measurements by three different subcontractor technicians for Unitymedia support to acknowledge the fact that the fault was indeed not located inside our building but somewhere between our building and the next distribution box down the road, making it their problem to fix. In the end, they had to dig up the sidewalk and got it fixed (which they did quite quickly and two days before Christmas, I must admit).
Anyhow, this ordeal has left me wary regarding cable internet and connection stability. In order to be prepared better for future issues, I wanted to have an aesthetically pleasing overview of current and historical connection quality metrics. Enter Prometheus and Grafana.
The Prometheus Connect Box exporter
Prometheus is an open-source event monitoring framework which can be used to monitor anything from MySQL databases to IPMI devices to Minecraft servers, assuming someone has written an exporter for those services.
I was most interested in monitoring the quality of downstream and upstream channels. Unitymedia’s Connect Box modem displays those details in its web interface:
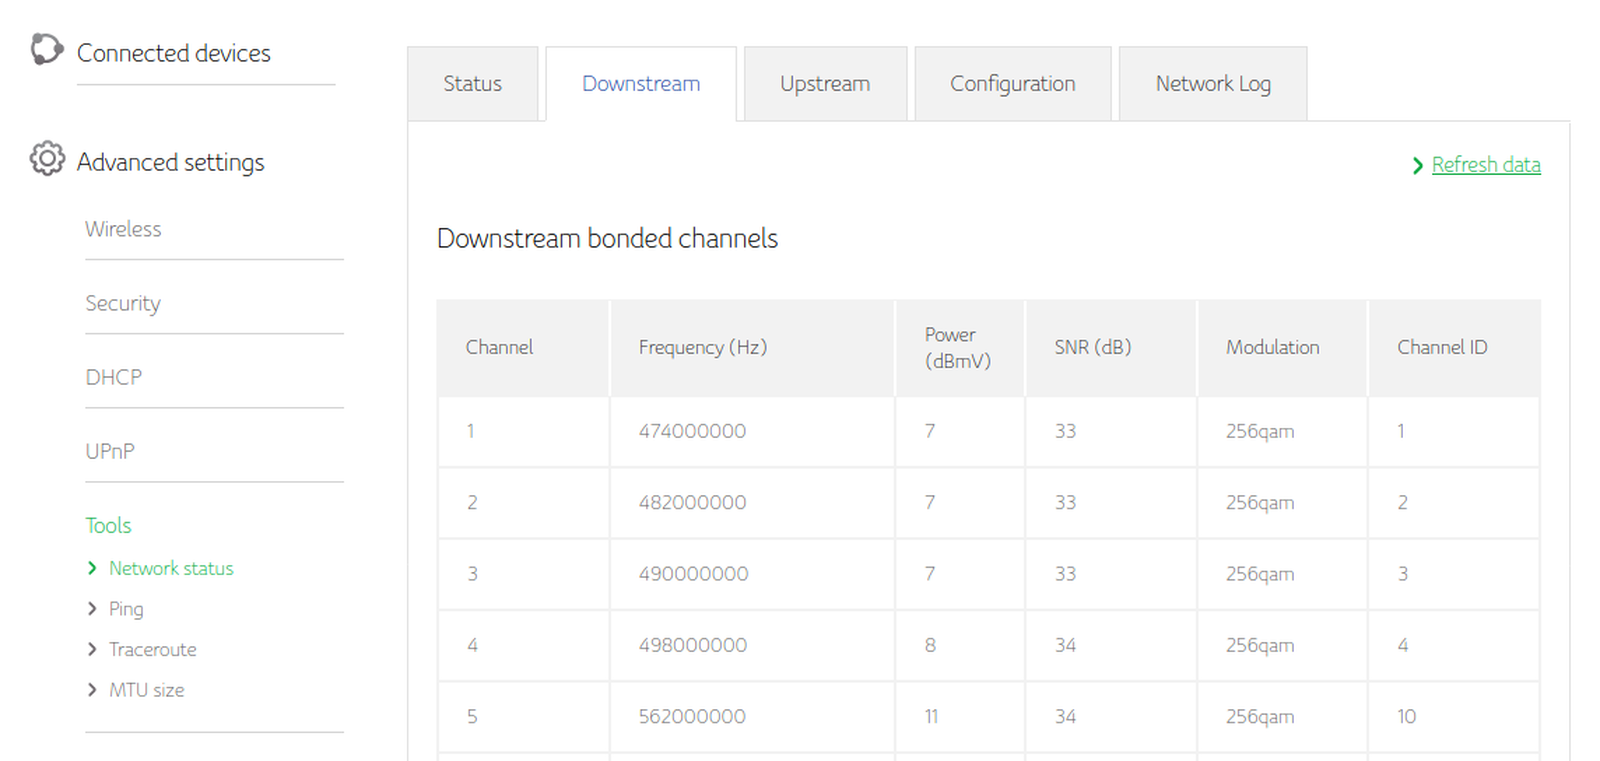
The web interface is password-protected, so accessing this information requires a bit of back and forth with HTTP requests. Thankfully, other people have meddled with this type of modem before, so there already existed the compal_CH7465LG_py library which handles the interfacing.
So, writing a Prometheus Connect Box exporter came down to just requesting interesting bits of information from the Connect Box and wrapping them in Prometheus' metric objects. The result:
# HELP connectbox_downstream_frequency_hz Downstream channel frequency
# TYPE connectbox_downstream_frequency_hz gauge
connectbox_downstream_frequency_hz{channel_id="31"} 7.7e+08
connectbox_downstream_frequency_hz{channel_id="30"} 7.62e+08
connectbox_downstream_frequency_hz{channel_id="29"} 7.54e+08
connectbox_downstream_frequency_hz{channel_id="28"} 7.46e+08
connectbox_downstream_frequency_hz{channel_id="27"} 7.06e+08
connectbox_downstream_frequency_hz{channel_id="26"} 6.98e+08
...
This information can be fed into Grafana, an open-source visualization tool built with monitoring (and Prometheus support) in mind. Here is the same information in a custom Grafana dashboard:
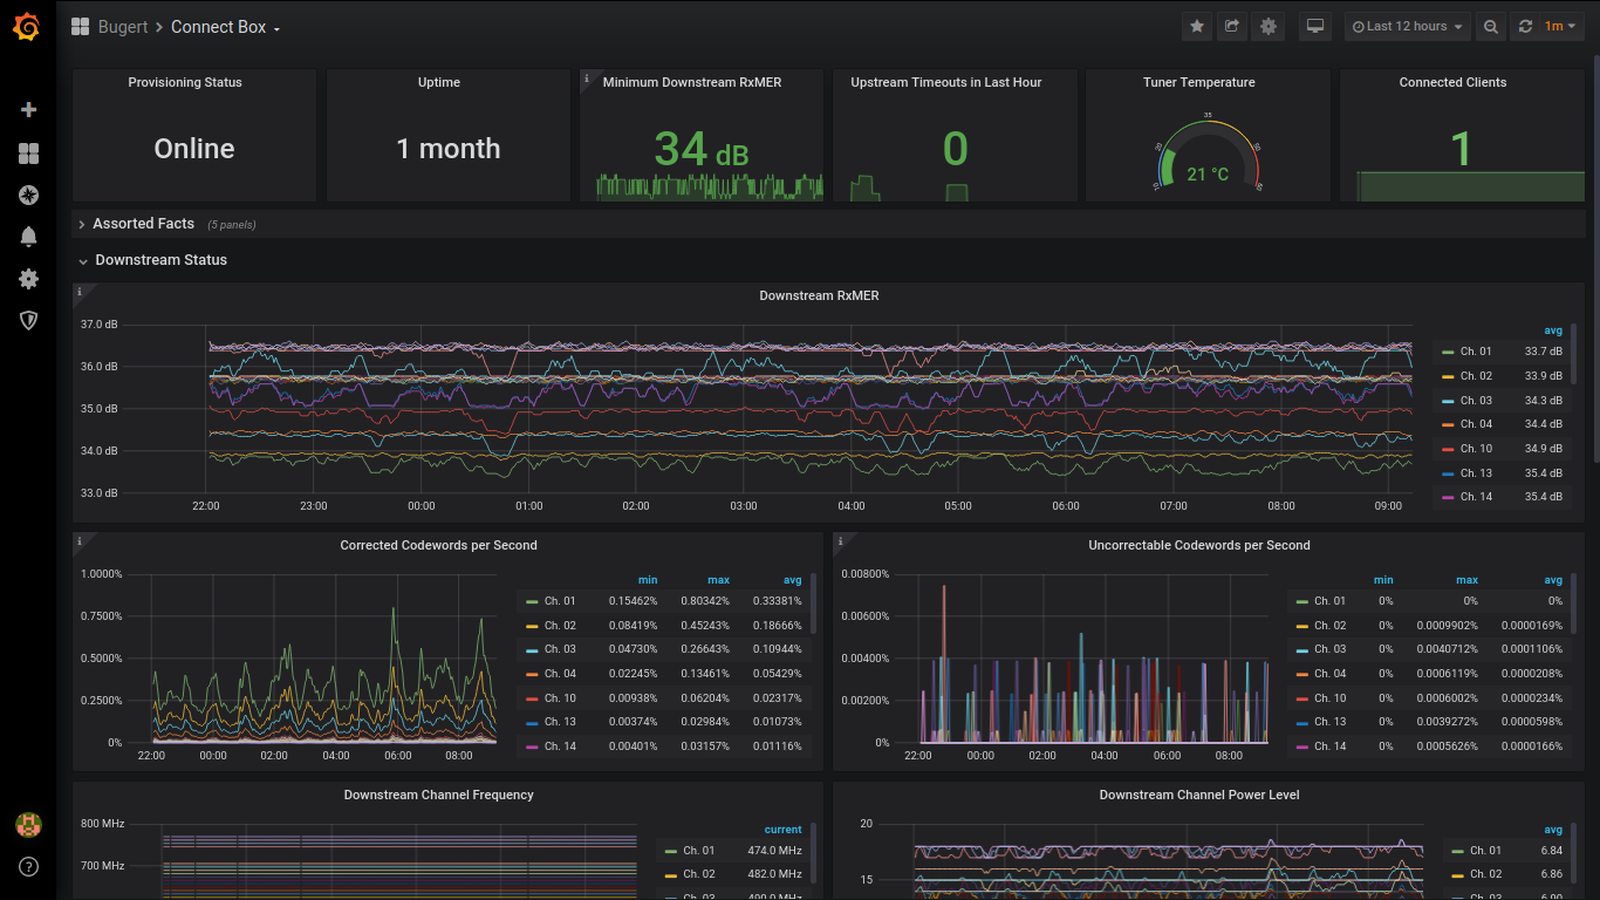
Very nice. A possible next step could be using Prometheus' alert manager to send automated alerts in case connection quality drops, but I didn’t tackle that yet.
Monitor your own Connect Box
If you own a Connect Box, you can monitor yours, too. I published the Prometheus exporter and the Grafana dashboard here:
- Prometheus exporter: https://github.com/mbugert/connectbox-prometheus
- Grafana dashboard: https://grafana.com/grafana/dashboards/12078 If you have not used Prometheus or Grafana yet, here is a blogpost to get you started.
If you tried it, I would love to hear from you how it went. Also, feel free to open issues or pull requests on Github. I, for myself, will keep monitoring my modem from now on. Hopefully there will be no new connection issues in the future and I will never need the dashboard. Let’s see.