Fancy Network Diagrams with LaTeX
Self-hosting pi-hole, Home Assistant, or another service is both fun and useful, but as the home network keeps growing, it becomes increasingly difficult to keep track of what’s running where and how things are connected.
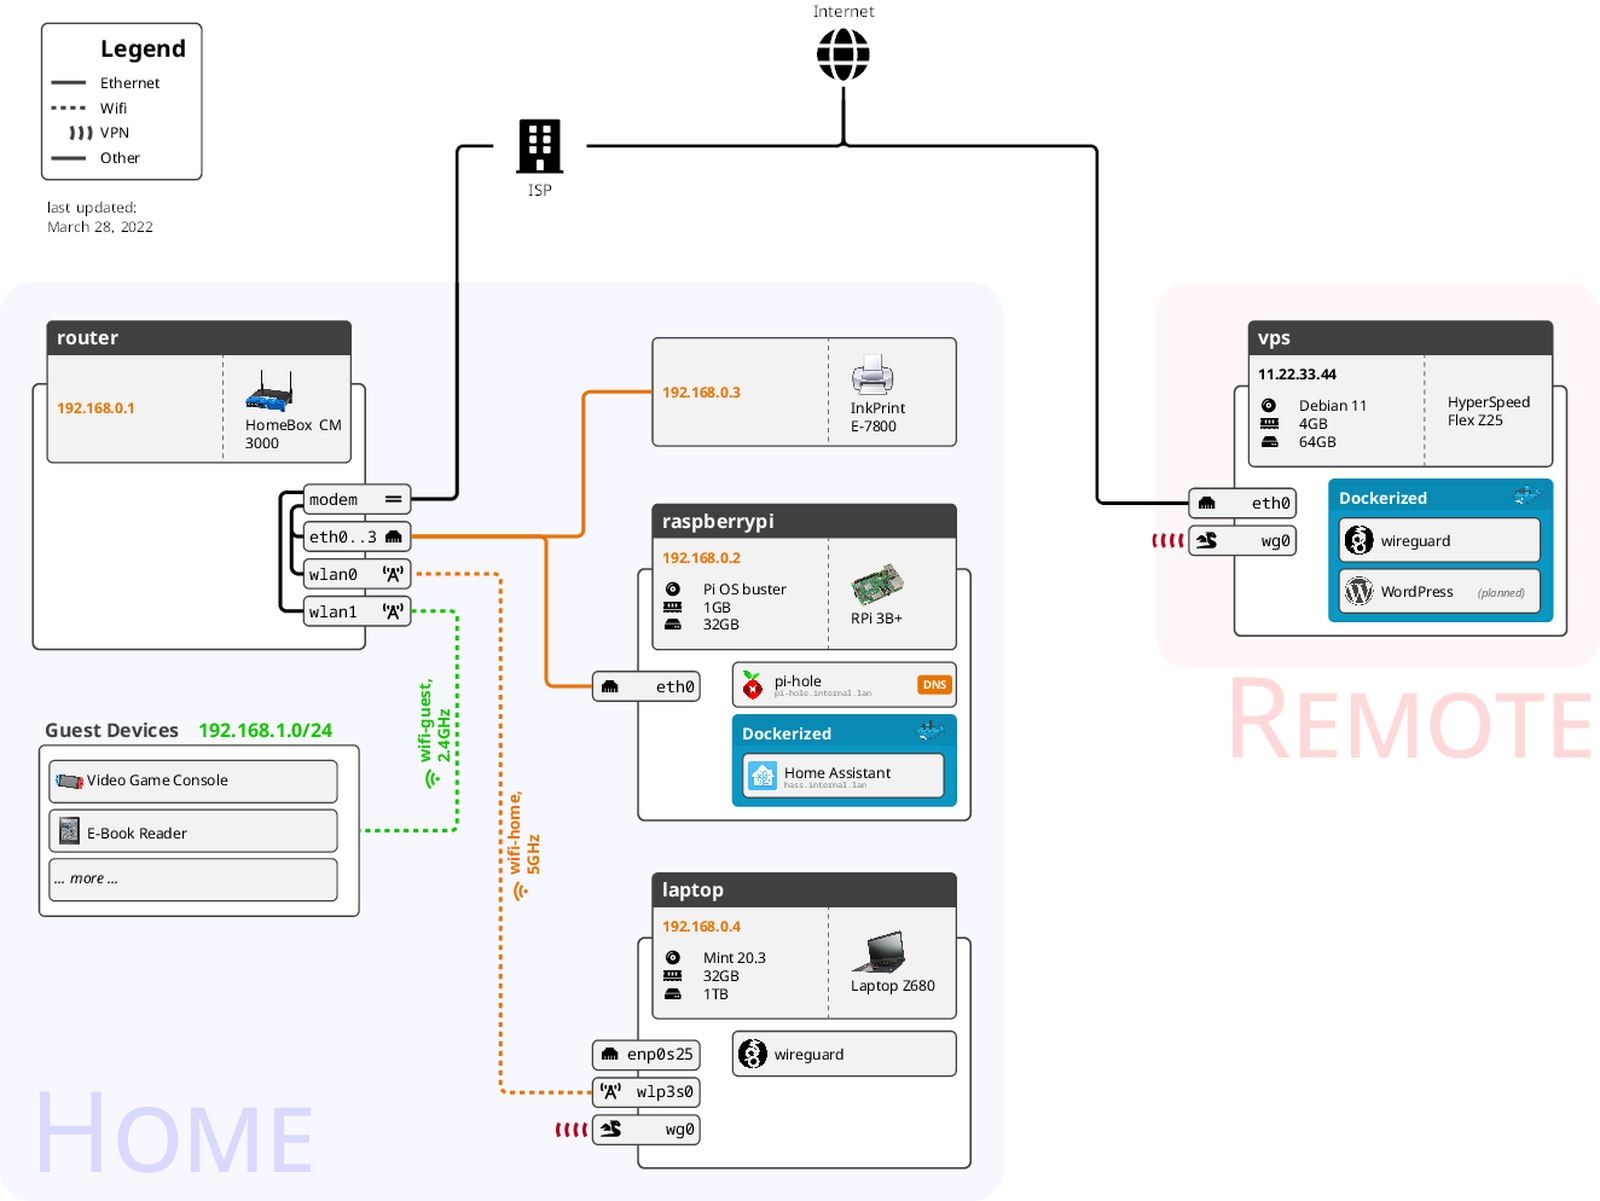
Fancy diagrams are fancy
I created a diagram of my home network with LaTeX for this reason. Here is a template so you can create your own: https://github.com/mbugert/latex-network-diagram-template
It’s based on a bunch of tcolorboxes inside a tikzpicture. Do note that extending the template absolutely requires prior experience with LaTeX, and having knowledge on TikZ is recommended.
Why LaTeX?
Many people use cloud-based services or good old Powerpoint to create these types of diagrams. Creating a large diagram with a WYSIWYG interfaces sounds to me sounds like hours of frustration with “smart” anchor points and repetitive clicking, so I chose the LaTeX route instead (which is painful in its own way, but in a way I can tolerate). Also, it’s free, open-source and relies on plaintext, so I can probably still use it in a decade. I’ll find out.